Port QoS
Display Contents (FC Port QoS, iSCSI Port QoS)
Overview
This function displays the bandwidth limit and the performance information of the ports that are registered in the storage system.
A list of the FC port QoS and the iSCSI port QoS is displayed for each type.
- The monitoring status of the performance information and obtained performance information are cleared in the following conditions:
The port mode is changed (from CA or CA/RA to other port modes)
The storage system is rebooted
An error is detected in the storage system
The hot maintenance of the CM is performed
The hot controller firmware upgrade is performed
The ports in the port mode of "CA" or "CA/RA" registered with the storage system are displayed, regardless of whether the ports are CA port group members.
This function displays the performance information that is obtained during performance monitoring regardless of whether the QoS mode is enabled or disabled. When the performance information is displayed before stopping performance monitoring, the performance information that is obtained from the start time until the time when displaying the performance information is requested is displayed. This function displays the performance information of each port.
Display Contents

FC Port QoS
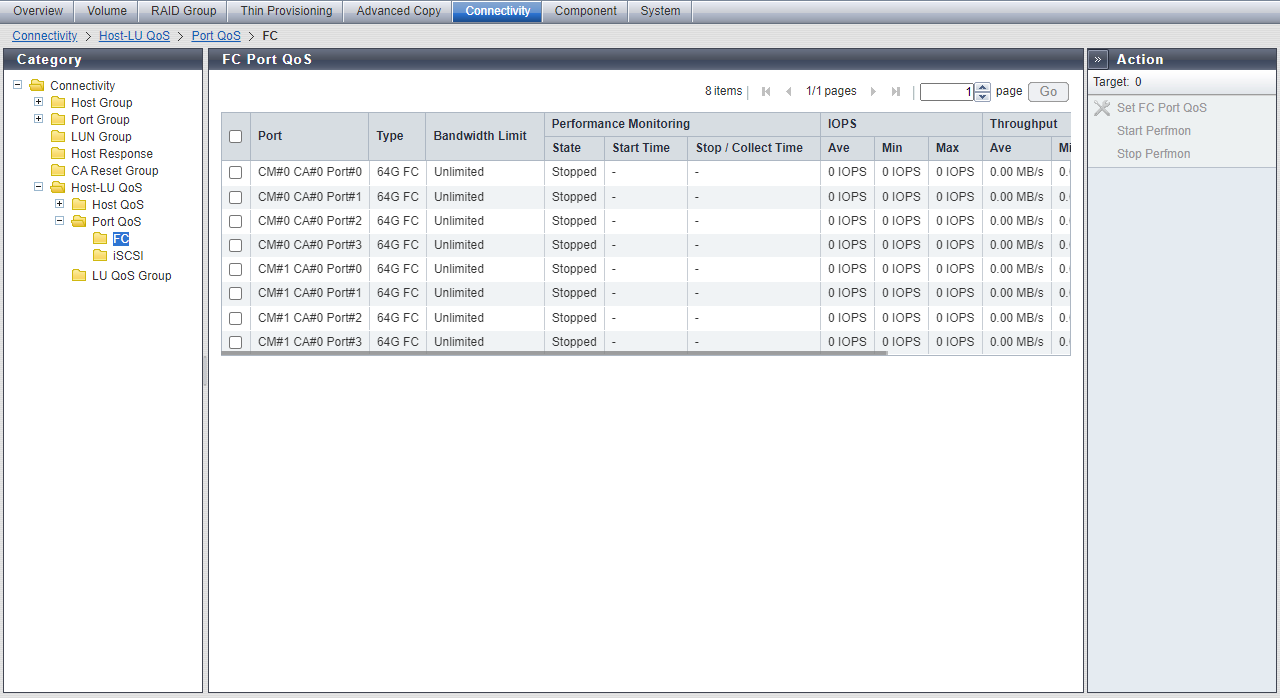
In this screen, the bandwidth limit and the performance information of the FC port are displayed.
| Item | Description | |||||||||||||||||||||||||||
|---|---|---|---|---|---|---|---|---|---|---|---|---|---|---|---|---|---|---|---|---|---|---|---|---|---|---|---|---|
|
Port |
The location information of the target port is displayed. CE#n CM#n CA#n Port#n or CM#n CA#n Port#n |
|||||||||||||||||||||||||||
|
Type |
The type of the target port is displayed. 16G FC 32G FC 64G FC |
|||||||||||||||||||||||||||
|
Bandwidth Limit |
The maximum performance of the target port is displayed in IOPS (throughput value). If the performance limit has not been configured, "Unlimited" is displayed. Refer to the "Port QoS" column in Bandwidth Limit for details. |
|||||||||||||||||||||||||||
|
Performance Monitoring |
State |
The status of performance monitoring for the port is displayed. Active Stopped |
||||||||||||||||||||||||||
|
Start Time |
The start time and the end time for performance monitoring are displayed. The displayed time varies depending on how the performance monitoring is started or ended.
Caution
|
|||||||||||||||||||||||||||
|
Stop / Collect Time |
||||||||||||||||||||||||||||
|
IOPS |
Ave |
The performance information from when performance monitoring is started until performance monitoring is ended (or performance information is displayed) is displayed. In this field, the average I/O count per second, the minimum I/O count per second, and the maximum I/O count per second are displayed. |
||||||||||||||||||||||||||
|
Min |
||||||||||||||||||||||||||||
|
Max |
||||||||||||||||||||||||||||
|
Throughput |
Ave |
The transfer data size from when performance monitoring is started until performance monitoring is ended (or performance information is displayed) is displayed. In this field, the average data transfer size per second, the minimum data transfer size per second, and the maximum data transfer size per second are displayed. |
||||||||||||||||||||||||||
|
Min |
||||||||||||||||||||||||||||
|
Max |
||||||||||||||||||||||||||||
|
Delay Time |
Total |
The total delay time for executing a command from when performance monitoring is started until performance monitoring is ended (or performance information is displayed) is displayed. If the total delay time reaches the maximum value, "Overflow" is displayed. |
||||||||||||||||||||||||||
|
Ave |
The average delay time per command from when performance monitoring is started until performance monitoring is ended (or performance information is displayed) is displayed. |
|||||||||||||||||||||||||||
iSCSI Port QoS
In this screen, the bandwidth limit and the performance information of the iSCSI port are displayed.
| Item | Description | |||||||||||||||||||||||||||
|---|---|---|---|---|---|---|---|---|---|---|---|---|---|---|---|---|---|---|---|---|---|---|---|---|---|---|---|---|
|
Port |
The location information of the target port is displayed. CE#n CM#n CA#n Port#n or CM#n CA#n Port#n |
|||||||||||||||||||||||||||
|
Type |
The type of the target port is displayed. 10G iSCSI |
|||||||||||||||||||||||||||
|
Bandwidth Limit |
The maximum performance of the target port is displayed in IOPS (throughput value). If the performance limit has not been configured, "Unlimited" is displayed. Refer to the "Port QoS" column in Bandwidth Limit for details. |
|||||||||||||||||||||||||||
|
Performance Monitoring |
State |
The status of performance monitoring for the port is displayed. Active Stopped |
||||||||||||||||||||||||||
|
Start Time |
The start time and the end time for performance monitoring are displayed. The displayed time varies depending on how the performance monitoring is started or ended.
Caution
|
|||||||||||||||||||||||||||
|
Stop / Collect Time |
||||||||||||||||||||||||||||
|
IOPS |
Ave |
The performance information from when performance monitoring is started until performance monitoring is ended (or performance information is displayed) is displayed. In this field, the average I/O count per second, the minimum I/O count per second, and the maximum I/O count per second are displayed. |
||||||||||||||||||||||||||
|
Min |
||||||||||||||||||||||||||||
|
Max |
||||||||||||||||||||||||||||
|
Throughput |
Ave |
The transfer data size from when performance monitoring is started until performance monitoring is ended (or performance information is displayed) is displayed. In this field, the average data transfer size per second, the minimum data transfer size per second, and the maximum data transfer size per second are displayed. |
||||||||||||||||||||||||||
|
Min |
||||||||||||||||||||||||||||
|
Max |
||||||||||||||||||||||||||||
|
Delay Time |
Total |
The total delay time for executing a command from when performance monitoring is started until performance monitoring is ended (or performance information is displayed) is displayed. If the total delay time reaches the maximum value, "Overflow" is displayed. |
||||||||||||||||||||||||||
|
Ave |
The average delay time per command from when performance monitoring is started until performance monitoring is ended (or performance information is displayed) is displayed. |
|||||||||||||||||||||||||||


