


Performance (CM)
Overview
This function displays the performance information of the CM.
Performance information is obtained when performance monitoring is operated from Web GUI, CLI, or any other monitoring software. Refer to the [Start/Stop Performance Monitoring] function for details on how to start performance monitoring with Web GUI.
The interval for acquiring performance information can be specified when starting the monitoring. When using Web GUI, the default interval is 30 seconds.
The average performance values during the specified interval are displayed.
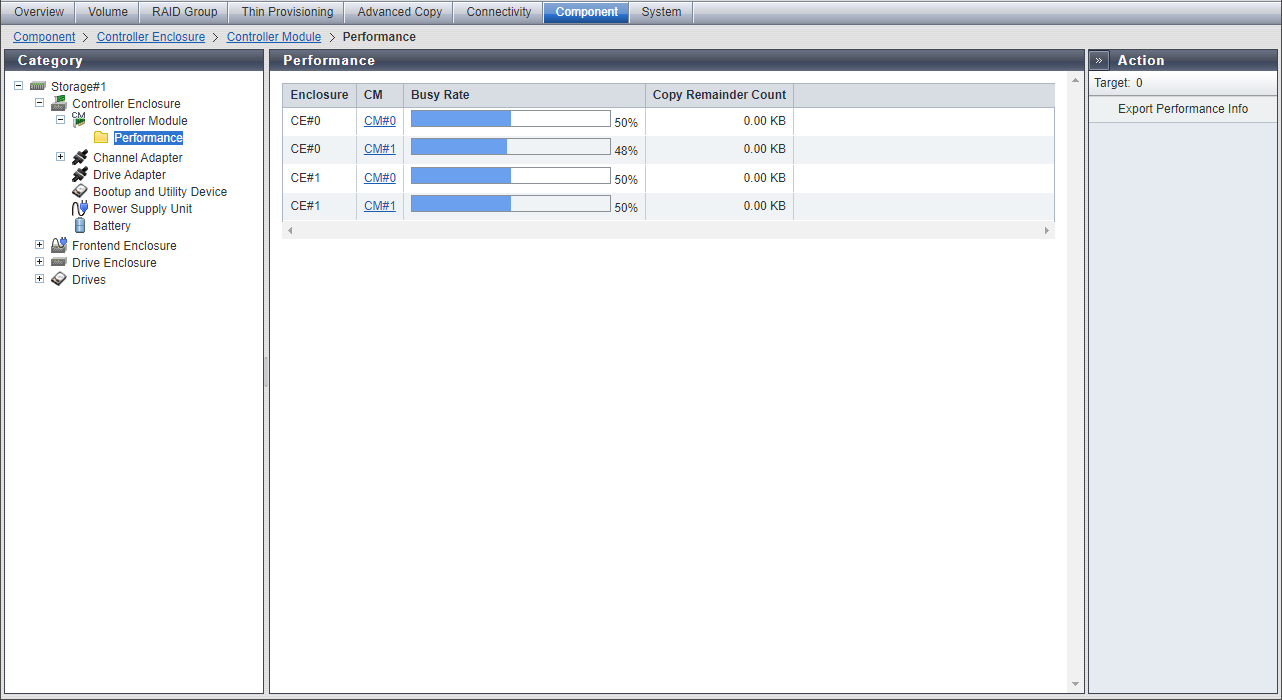
Display Contents
In this screen, performance information of the CM is displayed. When the performance monitoring function is stopped, "0" is displayed for the busy rate and the copy remainder count.
| Item | Description |
|---|---|
|
Enclosure |
The Controller Enclosure (CE) number is displayed. This is displayed for the ETERNUS DX900 S6 or the ETERNUS DX8900 S6. CE#n |
|
CM |
The CM number is displayed. Click this item to display the [Detailed CM Performance Information] Screen. CM#n |
|
Busy Rate |
The busy rate (0 to 100 %) of the CPU is displayed. |
|
Copy Remainder Count |
The copy remainder size of a copy session is displayed. "Copy Remainder Count" is displayed for each Controlling CM in the RAID group to which the copy source volume belongs. |
[Detailed CM Performance Information] Screen
CE#n CM#n Information (for the ETERNUS DX900 S6 or the ETERNUS DX8900 S6)CM#n Information (for the ETERNUS DX600 S6 or the ETERNUS DX8100 S6)
| Item | Description |
|---|---|
|
Location |
The CM number is displayed. CE#n CM#n or CM#n |
|
Busy Rate |
The busy rate (0 to 100 %) of the CPU is displayed. |
|
Copy Remainder Count |
The copy remainder size of a copy session is displayed. |
CE#n CM#n Core CPU Busy Rate (for the ETERNUS DX900 S6 or the ETERNUS DX8900 S6)CM#n Core CPU Busy Rate (for the ETERNUS DX600 S6 or the ETERNUS DX8100 S6)
| Item | Description |
|---|---|
|
Core |
The core number is displayed. Core#n |
|
Busy Rate |
The busy rate (0 to 100 %) of the core is displayed. |