


Performance (Drives)
Overview
This function displays the performance information of drives.
Performance information is obtained when performance monitoring is operated from Web GUI, CLI, or any other monitoring software. Refer to the [Start/Stop Performance Monitoring] function for details on how to start performance monitoring with Web GUI.
The interval for acquiring performance information can be specified when starting the monitoring. When using Web GUI, the default interval is 30 seconds.
The average performance values during the specified interval are displayed.
Display Contents
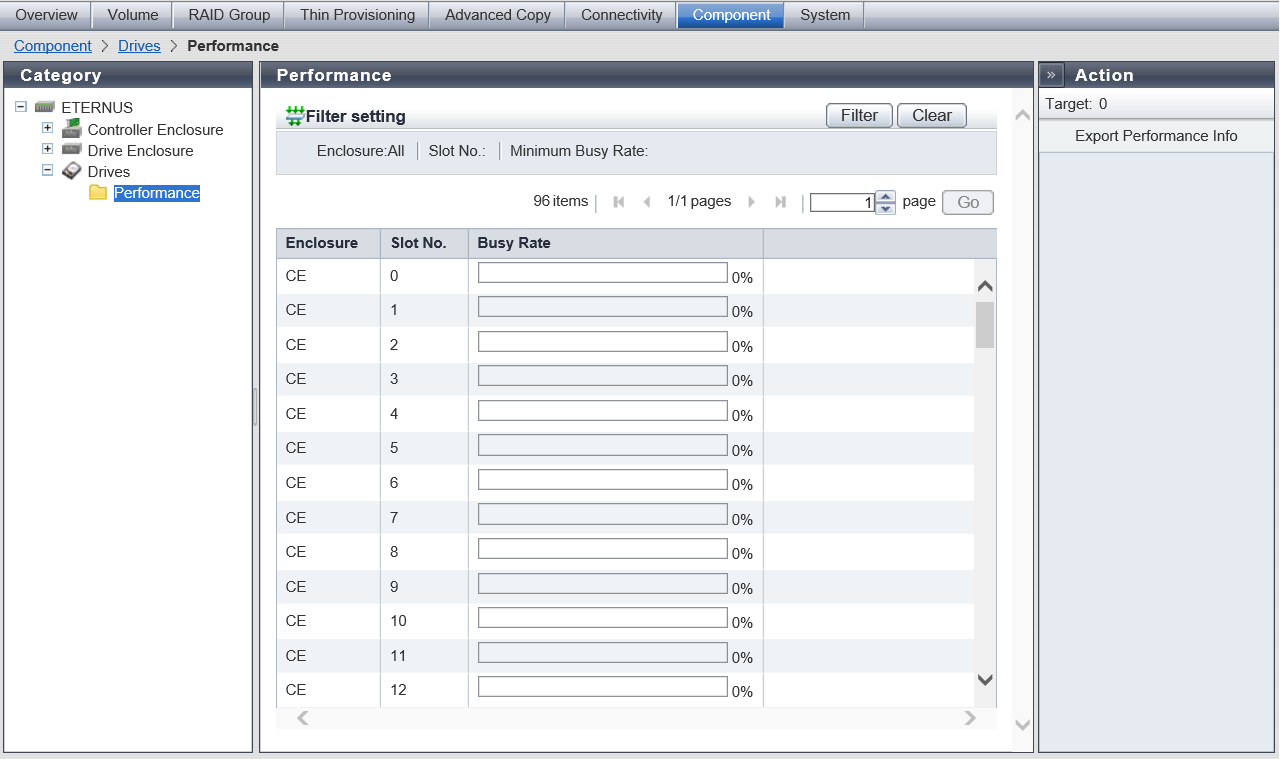
In this screen, performance information of drives is displayed.
| Item | Description |
|---|---|
|
Enclosure |
The enclosure where the drive is installed is displayed. CE: Controller Enclosure DE: Drive Enclosure CE CE#n DE#n |
|
Slot No. |
The slot number of the enclosure where the drive is installed is displayed. |
|
Busy Rate |
The busy rate (0 to 100 %) of the drive is displayed with a bar and a numerical number. When a drive is in the "Broken" or "Not Supported" state, a "-" (hyphen) is displayed. |