


Performance (Advanced Copy)
Overview
This function displays the performance information of the volumes for Advanced Copy.
The performance information of the Data Container Volume is not displayed.
Performance information is obtained when performance monitoring is operated from Web GUI, CLI, or any other monitoring software. Refer to the [Start/Stop Performance Monitoring] function for details on how to start performance monitoring with Web GUI.
The interval for acquiring performance information can be specified when starting the monitoring. When using Web GUI, the default interval is 30 seconds.
The average performance values during the specified interval are displayed.
When the performance monitoring function is stopped, "0" is displayed as the performance information.
In this manual, "volumes" include "External Volumes" if differentiation is not specifically required.
Display Contents
In this screen, the performance information of the volumes for Advanced Copy is displayed. When the performance monitoring function is stopped, "0" is displayed as the performance information.
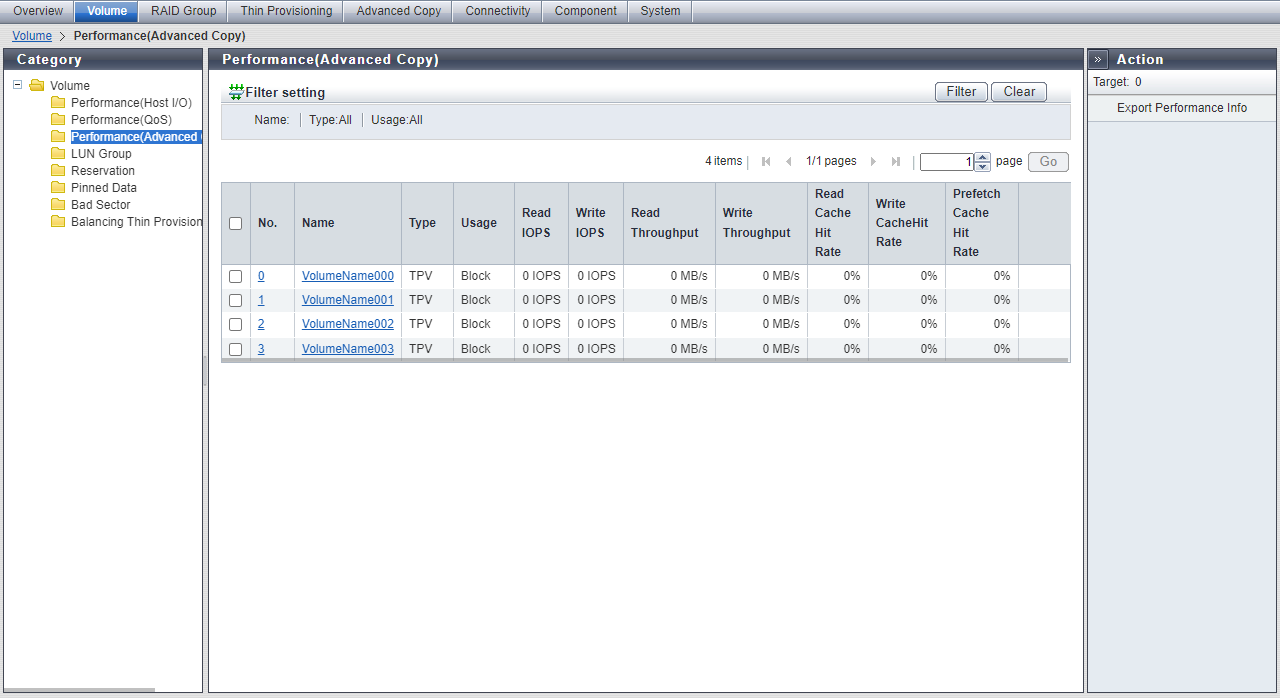
Volume List
| Item | Description |
|---|---|
No. |
The volume number is displayed. Click this item to display the [Volume Detail] screen ([Basic] tab). |
Name |
The volume name is displayed. Click this item to display the [Volume Detail] screen ([Basic] tab). |
Type |
The volume type is displayed. Standard WSV TPV FTV SDV SDPV Temporary |
Usage |
The usage of the volume is displayed. Refer to Usage of Volumes for details. |
Read IOPS |
The number of reads per second is displayed. |
Write IOPS |
The number of writes per second is displayed. |
Read Throughput |
The amount of transferred data that is read per second is displayed. |
Write Throughput |
The amount of transferred data that is written per second is displayed. |
Read Cache Hit Rate |
The cache hit rate (0 to 100 %) (for read) is displayed. |
Write Cache Hit Rate |
The cache hit rate (0 to 100 %) (for write) is displayed. |
Prefetch Cache Hit Rate |
The cache hit rate (0 to 100 %) (for prefetch) is displayed. |
Extreme Cache Cache Hit Rate |
The cache hit rate (0 to 100 %) of Extreme Cache for read I/O is displayed. This item is displayed if Extreme Cache Pool of the storage system is enabled. A "-" (hyphen) is usually displayed for the following volumes:
Note
|
[Volume Detail] Screen ([Basic] Tab)
Click the [Performance Information (Advanced Copy)] tab to display the detailed information.
[Performance (Advanced Copy)] Screen
The volume number, volume name, type, and usage are displayed.
| Item | Description |
|---|---|
Read IOPS |
The number of reads per second is displayed. |
Write IOPS |
The number of writes per second is displayed. |
Read Throughput |
The amount of transferred data that is read per second is displayed. |
Write Throughput |
The amount of transferred data that is written per second is displayed. |
Read Cache Hit Rate |
The cache hit rate (0 to 100 %) (for read) is displayed. |
Write Cache Hit Rate |
The cache hit rate (0 to 100 %) (for write) is displayed. |
Prefetch Cache Hit Rate |
The cache hit rate (0 to 100 %) (for prefetch) is displayed. |
Extreme Cache Cache Hit Rate |
The cache hit rate (0 to 100 %) of Extreme Cache for read I/O is displayed. This item is displayed if Extreme Cache Pool of the storage system is enabled. A "-" (hyphen) is usually displayed for the following volumes: |