


Performance (Host I/O)
Overview
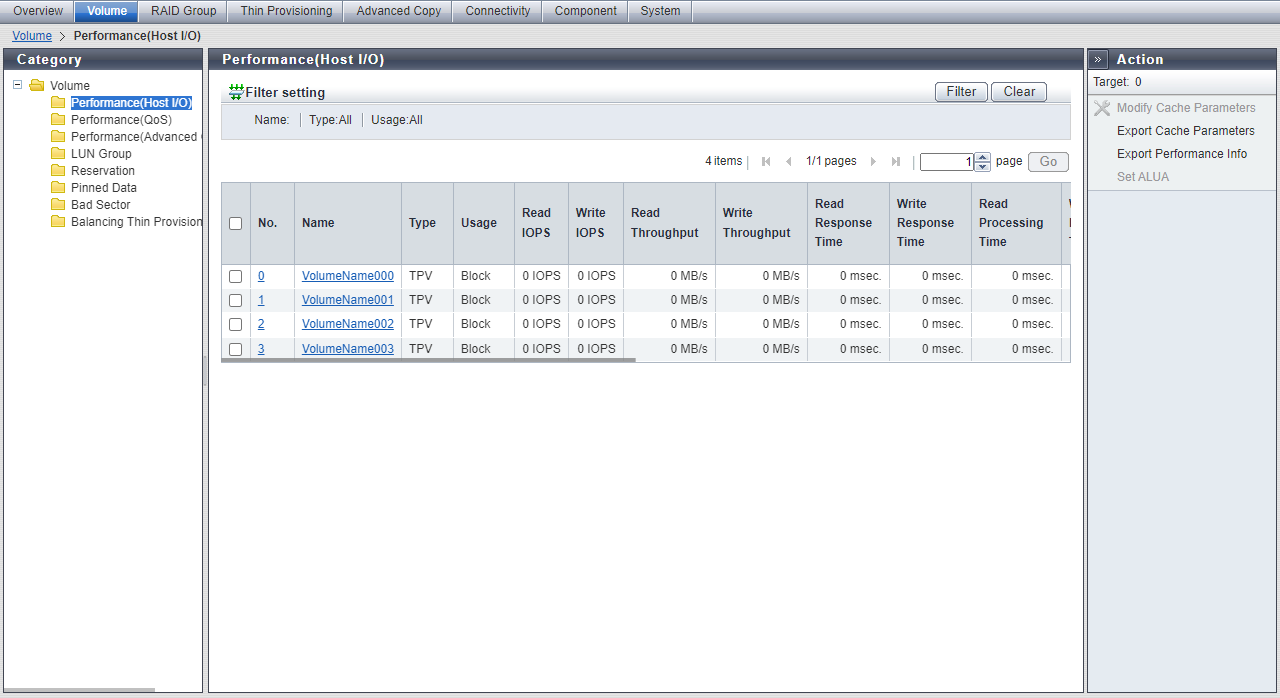
This function displays the performance information of the volumes for Host I/O.
Performance information is obtained when performance monitoring is operated from Web GUI, CLI, or any other monitoring software. Refer to the [Start/Stop Performance Monitoring] function for details on how to start performance monitoring with Web GUI.
The interval for acquiring performance information can be specified when starting the monitoring. When using Web GUI, the default interval is 30 seconds.
The average performance values during the specified interval are displayed.
When the performance monitoring function is stopped, "0" is displayed as the performance information.
This function displays the parameter that is set in the [Modify Cache Parameters] function.
This function displays the parameter (ALUA) that is set in the [Set ALUA] function.
In this manual, "volumes" include "External Volumes" if differentiation is not specifically required.
Display Contents
In this screen, the performance information of the volumes for Host I/O is displayed. When the performance monitoring function is stopped, "0" is displayed as the performance information.
Volume List
| Item | Description | |||
|---|---|---|---|---|
No. |
The volume number is displayed. Click this item to display the [Volume Detail] screen ([Basic] tab). |
|||
Name |
The volume name is displayed. Click this item to display the [Volume Detail] screen ([Basic] tab). |
|||
Type |
The volume type is displayed. Standard WSV TPV FTV SDV SDPV Temporary |
|||
Usage |
The usage of the volume is displayed. Refer to Usage of Volumes for details. |
|||
Read IOPS |
The number of reads per second is displayed. A "-" (hyphen) is displayed for the Data Container Volume. |
|||
Write IOPS |
The number of writes per second is displayed. A "-" (hyphen) is displayed for the Data Container Volume. |
|||
Read Throughput |
The amount of transferred data that is read per second is displayed. A "-" (hyphen) is displayed for the Data Container Volume. |
|||
Write Throughput |
The amount of transferred data that is written per second is displayed. A "-" (hyphen) is displayed for the Data Container Volume. |
|||
Data Compression Rate |
The compression rate (1 to 100 %) of the data that is written to the Deduplication/Compression Volume from the host is displayed. A "-" (hyphen) is displayed for a volume other than the Deduplication/Compression Volume. This item is displayed only when the Deduplication/Compression function is enabled. Note
|
|||
Unaligned I/O Rate |
The percentage (1 to 100 %) of data unsuited for the basic data size of the compression process among the data read/written from the host to the Deduplication/Compression Volume is displayed. A "-" (hyphen) is displayed for a volume other than the Deduplication/Compression Volume. This item is displayed only when the Deduplication/Compression function is enabled. Caution
|
|||
Read Response Time |
The average read response time per host I/O is displayed. A "-" (hyphen) is displayed for the Data Container Volume. |
|||
Write Response Time |
The average write response time per host I/O is displayed. A "-" (hyphen) is displayed for the Data Container Volume. |
|||
Read Processing Time |
The average read processing time per host I/O is displayed. A "-" (hyphen) is displayed for the Data Container Volume. |
|||
Write Processing Time |
The average write processing time per host I/O is displayed. A "-" (hyphen) is displayed for the Data Container Volume. |
|||
Read Cache Hit Rate |
The cache hit rate (0 to 100 %) (for read) is displayed. A "-" (hyphen) is displayed for the Data Container Volume. |
|||
Write Cache Hit Rate |
The cache hit rate (0 to 100 %) (for write) is displayed. A "-" (hyphen) is displayed for the Data Container Volume. |
|||
Prefetch Cache Hit Rate |
The cache hit rate (0 to 100 %) (for prefetch) is displayed. A "-" (hyphen) is displayed for the Data Container Volume. |
|||
Extreme Cache Cache Hit Rate |
The cache hit rate (0 to 100 %) of Extreme Cache for read I/O is displayed. This item is displayed if Extreme Cache Pool of the storage system is enabled. A "-" (hyphen) is usually displayed for the following volumes:
Note
|
|||
Cache Page Capacity |
The cache page capacity is displayed. When the cache page capacity is "-" (hyphen), there is no limit for the cache capacity. A "-" (hyphen) is displayed when the volume type is "TPV", "FTV", or "WSV". Note that a "-" (hyphen) is displayed for a "Standard" type volume that is concatenated by the LUN Concatenation function. |
|||
PL |
The prefetch limit is displayed. If PL is "0", prefetch is not performed. |
|||
FP |
The selected usage for the Force Prefetch Mode, which performs forcible prefetching for cache, is displayed.
|
|||
MWC |
The value of the Multi Writeback Count is displayed. A "-" (hyphen) is displayed when the volume type is "TPV" or "FTV". Note that a "-" (hyphen) is displayed for a "Standard" type volume that is concatenated by the LUN Concatenation function. |
|||
PSDC |
The number of times that sequentiality of data access (Read I/O) is detected (value of the Prefetch Sequential Detect Count) is displayed. If any sequential data is accessed for the number of times specified for PSDC, such access is determined as sequential access and prefetch is performed. |
|||
SDDC |
The number of times that sequentiality of data access (Write I/O) is detected (value of the Sequential Dirty Detect Count) is displayed. If any sequential data is accessed for the number of times specified for SDDC, such access is determined as sequential access and prefetch is performed. |
|||
SS |
The value of the parameter (Sequential Slope) to determine the sequentiality of data access (Read I/O) is displayed. If the difference in addresses between the end LBA of the previous I/O and the start LBA of the current I/O is within (SS setting + 1), it is determined as sequential data. |
|||
SDS |
The value of the parameter (Sequential Dirty Slope) to determine sequential data access (Write I/O) is displayed. If the difference in addresses between the end LBA of the previous I/O and the start LBA of the current I/O is within (SDS setting + 1), it is determined as sequential data. |
|||
SPMC |
The value of the parameter (Sequential Parallel Multi I/O Count) to determine the sequentiality of data access (Read I/O and Write I/O) is displayed. If the difference in addresses between the start address of the previous I/O and the start address of the received I/O is within (I/O size × Specified value), it is determined as sequential data. |
|||
ALUA |
The set state for Asymmetric Logical Unit Access (ALUA) is displayed. A "-" (hyphen) is displayed for any volumes that cannot be mapped (*1).
|
[Volume Detail] Screen ([Basic] Tab)
Click the [Performance (Host I/O)] tab to display the detailed information.
[Performance (Host I/O)] Screen
The volume number, volume name, type, and usage are displayed.
| Item | Description |
|---|---|
Read IOPS |
The number of reads per second is displayed. |
Write IOPS |
The number of writes per second is displayed. |
Read Throughput |
The amount of transferred data that is read per second is displayed. |
Write Throughput |
The amount of transferred data that is written per second is displayed. |
Data Compression Rate |
The compression rate (1 to 100 %) of the data that is written to the Deduplication/Compression Volume from the host is displayed. A "-" (hyphen) is displayed for a volume other than the Deduplication/Compression Volume. This item is displayed only when the Deduplication/Compression function is enabled. |
Unaligned I/O Rate |
The percentage (1 to 100 %) of data unsuited for the basic data size of the compression process among the data written from the host to the Deduplication/Compression Volume is displayed. A "-" (hyphen) is displayed for a volume other than the Deduplication/Compression Volume. This item is displayed only when the Deduplication/Compression function is enabled. |
Read Response Time |
The average read response time per host I/O is displayed. |
Write Response Time |
The average write response time per host I/O is displayed. |
Read Processing Time |
The average read processing time per host I/O is displayed. |
Write Processing Time |
The average write processing time per host I/O is displayed. |
Read Cache Hit Rate |
The cache hit rate (0 to 100 %) (for read) is displayed. |
Write Cache Hit Rate |
The cache hit rate (0 to 100 %) (for write) is displayed. |
Prefetch Cache Hit Rate |
The cache hit rate (0 to 100 %) (for prefetch) is displayed. |
Extreme Cache Cache Hit Rate |
The cache hit rate (0 to 100 %) of Extreme Cache for read I/O is displayed. This item is displayed if Extreme Cache Pool of the storage system is enabled. A "-" (hyphen) is usually displayed for the following volumes: |
Cache Page Capacity |
The cache page capacity is displayed. When the cache page capacity is "-" (hyphen), there is no limit for the cache capacity. A "-" (hyphen) is displayed when the volume type is "TPV", "FTV", or "WSV". Note that a "-" (hyphen) is displayed for a "Standard" type volume that is concatenated by the LUN Concatenation function. |
PL |
The prefetch limit is displayed. |
FP |
The selected usage for the Force Prefetch Mode, which performs forcible prefetching for cache, is displayed. |
MWC |
The value of the Multi Writeback Count is displayed. A "-" (hyphen) is displayed when the volume type is "TPV" or "FTV". Note that a "-" (hyphen) is displayed for a "Standard" type volume that is concatenated by the LUN Concatenation function. |
PSDC |
The number of times that sequential data access is detected (value of the Prefetch Sequential Detect Count) is displayed. |
SDDC |
The number of times that sequentiality of data access (Write I/O) is detected (value of the Sequential Dirty Detect Count) is displayed. |
SS |
The value of the parameter (Sequential Slope) to determine the sequentiality of data access (Read I/O) is displayed. |
SDS |
The value of the parameter (Sequential Dirty Slope) to determine sequential data access (Write I/O) is displayed. |
SPMC |
The value of the parameter (Sequential Parallel Multi I/O Count) to determine the sequentiality of data access (Read I/O and Write I/O) is displayed. |
ALUA |
The set state for Asymmetric Logical Unit Access (ALUA) is displayed. A "-" (hyphen) is displayed for any volumes that cannot be mapped. Follow Host Response ACTIVE / ACTIVE ACTIVE-ACTIVE / PREFERRED_PATH |