


Host-LU QoS
Overview
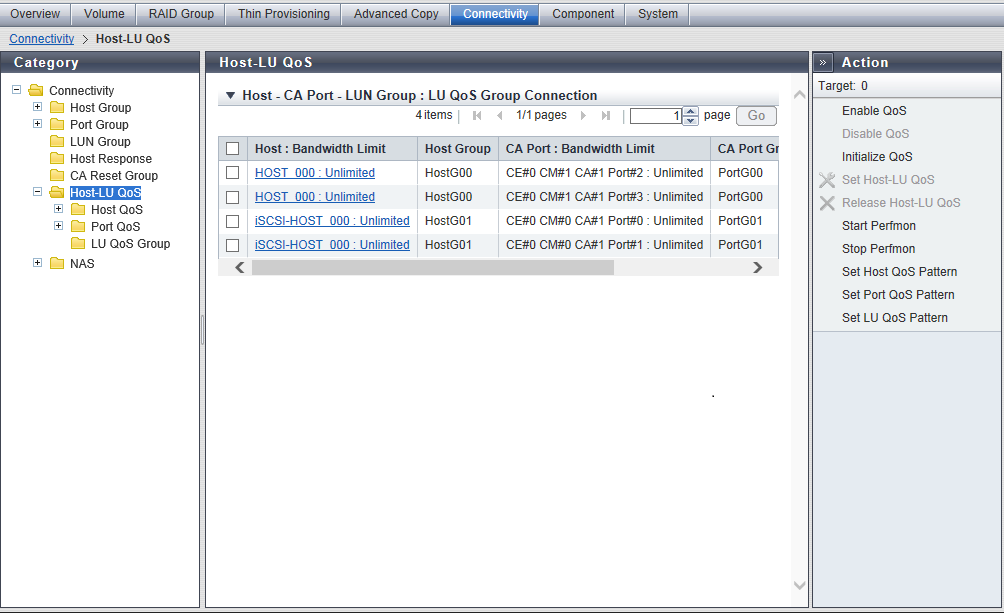
This function displays a list of Host-LU QoS.
The Host-LU QoS list shows the association between "Host", "CA Port", and "LUN Group", bandwidth limit (performance limits), and performance information.
The ETERNUS DX60 S5 does not support this function.
When using Web GUI, schedule settings for QoS parameters and displaying scheduled QoS parameters are not available. Use CLI to check the scheduled QoS parameters that are specified using CLI. Web GUI displays only the bandwidth limit and the performance information that are specified by using Web GUI.
Host-LU QoS does not support from LUN#1024 onward. If volumes are mapped from LUN#1024 onward, only the first 1024 LUNs (LUN#0 - LUN#1023) are displayed.
Whether the QoS mode is enabled or disabled can be checked in the action field. Refer to the [Enable/Disable QoS] function for details.
Host-LU QoS starts its operation by configuring the bandwidth limit on "hosts", "CA ports", or "Host LUNs", and enabling the QoS mode.
This function displays the performance information that is obtained during performance monitoring regardless of whether the QoS mode is enabled or disabled. When the performance information is displayed before stopping performance monitoring, the performance information that is obtained from the start time until the time when displaying the performance information is requested is displayed. This function displays the total performance information for the host and the performance information for each host LUN.
The performance information of each CA port can also be displayed. Refer to the [Port QoS] function for details.
User Privileges
Availability of Executions in the Default Role
| Default role | Availability of executions |
|---|---|
| Monitor | |
| Admin | |
| StorageAdmin | |
| AccountAdmin | |
| SecurityAdmin | |
| Maintainer |
Refer to "User Roles and Policies" for details on the policies and roles.
Display Contents
Host-LU QoS List
The Host-LU QoS list displays the bandwidth limit on the hosts, CA ports, and host LUNs.
| Item | Description |
|---|---|
|
Host : Bandwidth Limit |
[Host] The host name for which the host affinity setting is configured is displayed. If any host can be the connection target, "All" is displayed. [Bandwidth Limit] The maximum performance is displayed in IOPS (throughput value). If the performance limit has not been configured, "Unlimited" is displayed. Refer to the "Host QoS" column in Bandwidth Limit for details. If "All" has been selected for hosts, a "-" (hyphen) is displayed. Click the [Host : Bandwidth Limit] link to display the performance information for all hosts or for each host LUN. Refer to the "[Host-LU QoS Performance Information] Screen" for details. |
|
Host Group |
If a host belongs to a host group as a member, the host group name is displayed. If the host does not belong to a host group as a member, a "-" (hyphen) is displayed. If any host can be the connection target, "All" is displayed. |
|
CA Port : Bandwidth Limit |
[CA Port] The location information of the CA port with the host affinity setting is displayed. For the ETERNUS DX900 S5 or the ETERNUS DX8900 S4 CE#x CM#y CA#z Port#w For the other models CM#y CA#z Port#w x: CE number y: CM number z: CA number w: Port number [Bandwidth Limit] The maximum performance is displayed in IOPS (throughput value). If the performance limit has not been configured, "Unlimited" is displayed. Refer to the "Port QoS" column in Bandwidth Limit for details. |
|
CA Port Group |
If a CA port belongs to a CA port group as a member, the CA port group name is displayed. If the CA port does not belong to a CA port group as a member, a "-" (hyphen) is displayed. |
|
LUN Group : LU QoS Group |
[LUN Group] The LUN group name is displayed. If the host, ports, and LUNs are allocated without specifying a host group or port group by an application other than Web GUI, a "-" (hyphen) is displayed. [LU QoS Group] The LU QoS group number (0 to 1055) is displayed. If an LU QoS group number has not been configured, a "- " (hyphen) is displayed. Click the [LUN Group : LU QoS Group] link to display a bandwidth limit on each host LUN. Refer to "[LUN Group : LU QoS Group Detailed Information] Screen" for details. |
[LUN Group : LU QoS Group Detailed Information] Screen
Click the [LUN Group : LU QoS Group] link on the Host-LU QoS list to display a bandwidth limit on each host LUN.
LUN Group : LU QoS Group information
| Item | Description |
|---|---|
|
LUN Group |
The LUN group name is displayed. If the host, ports, and LUNs are allocated without specifying a host group or port group by an application other than Web GUI, a "-" (hyphen) is displayed. |
|
LU QoS Group No. |
The LU QoS group number (0 to 1055) is displayed. If an LU QoS group number has not been configured, a "- " (hyphen) is displayed. |
A list of the host LUNs, which have been registered in the corresponding host group, is displayed.
| Item | Description |
|---|---|
|
Host LUN |
The host LUN (0 to 1023) is displayed. |
|
Name |
The volume name allocated to the host LUN is displayed. |
|
Bandwidth Limit |
The maximum performance is displayed in IOPS (throughput value). If the performance limit has not been configured, "Unlimited" is displayed. Refer to the "LUN QoS" column in Bandwidth Limit for details. |
Bandwidth Limit
The QoS pattern for hosts, CA ports, host LUNs, and volumes can be set with Web GUI or CLI according to the target QoS.
The default bandwidth limits are as follows:
| Host QoS | Port QoS | LUN QoS | Volume QoS | |
|---|---|---|---|---|
|
Bandwidth Limit |
Unlimited 15000 IOPS (800 MB/s) 12600 IOPS (700 MB/s) 10020 IOPS (600 MB/s) 7500 IOPS (500 MB/s) 5040 IOPS (400 MB/s) 3000 IOPS (300 MB/s) 1020 IOPS (200 MB/s) 780 IOPS (100 MB/s) 600 IOPS (70 MB/s) 420 IOPS (40 MB/s) 300 IOPS (25 MB/s) 240 IOPS (20 MB/s) 180 IOPS (15 MB/s) 120 IOPS (10 MB/s) 60 IOPS (5 MB/s) |
Unlimited 27000 IOPS (1000 MB/s) 21000 IOPS (850 MB/s) 15000 IOPS (700 MB/s) 10020 IOPS (600 MB/s) 8040 IOPS (500 MB/s) 6000 IOPS (400 MB/s) 5040 IOPS (300 MB/s) 4020 IOPS (250 MB/s) 3000 IOPS (200 MB/s) 2040 IOPS (160 MB/s) 1020 IOPS (125 MB/s) 720 IOPS (90 MB/s) 480 IOPS (60 MB/s) 240 IOPS (30 MB/s) 120 IOPS (15 MB/s) |
Unlimited 15000 IOPS (800 MB/s) 12600 IOPS (700 MB/s) 10020 IOPS (600 MB/s) 7500 IOPS (500 MB/s) 5040 IOPS (400 MB/s) 3000 IOPS (300 MB/s) 1020 IOPS (200 MB/s) 780 IOPS (100 MB/s) 600 IOPS (70 MB/s) 420 IOPS (40 MB/s) 300 IOPS (25 MB/s) 240 IOPS (20 MB/s) 180 IOPS (15 MB/s) 120 IOPS (10 MB/s) 60 IOPS (5 MB/s) |
Unlimited 15000 IOPS (800 MB/s) 12600 IOPS (700 MB/s) 10020 IOPS (600 MB/s) 7500 IOPS (500 MB/s) 5040 IOPS (400 MB/s) 3000 IOPS (300 MB/s) 1020 IOPS (200 MB/s) 780 IOPS (100 MB/s) 600 IOPS (70 MB/s) 420 IOPS (40 MB/s) 300 IOPS (25 MB/s) 240 IOPS (20 MB/s) 180 IOPS (15 MB/s) 120 IOPS (10 MB/s) 60 IOPS (5 MB/s) |
- The bandwidth limit can be changed using the following functions. The bandwidth limit changed by using the CLI command is also applied to the bandwidth limit that is specified with Web GUI.
-
Set Host QoS Pattern
-
Set Port QoS Pattern
-
Set LU QoS Pattern
-
Set Volume QoS Pattern
-
"set qos-bandwidth-limit" CLI command
-
[Host-LU QoS Performance Information] Screen
When a host affinity setting with a specific host group is already configured, the total performance information for the host and the performance information of each host LUN are displayed.
If a host affinity setting with any host is configured ("All" is displayed as the target host), the performance information of each host LUN is displayed.
- The monitoring status of the performance information and obtained performance information are cleared in the following conditions:
-
The port mode is changed (from CA or CA/RA to other port modes)
-
The storage system is rebooted
-
An error is detected in the storage system
-
The hot maintenance of the CM is performed
-
The hot controller firmware upgrade is performed
-
Host - CA Port - LUN Group Information
| Item | Description |
|---|---|
|
Host : Bandwidth Limit |
The host name and the bandwidth limit of the selected host is displayed in "Host : Bandwidth Limit" format. If any host can be the connection target, "All" is displayed for "Host" and a "-" (hyphen) is displayed for "Bandwidth Limit". If the performance limit has not been configured, "Unlimited" is displayed for "Bandwidth Limit". Refer to the "Host QoS" column in Bandwidth Limit for details. |
|
Host Group |
The name of the host group to which the selected host belongs is displayed. If any host can be the connection target, "All" is displayed. If the host does not belong to a host group, a "-" (hyphen) is displayed. |
|
WWN |
The WWN for the selected host is displayed. This item is displayed when the host affinity setting is configured and the selected host is "FC". |
|
iSCSI Name |
The iSCSI name of the selected host is displayed. This item is displayed when the host affinity setting is configured and the selected host is "iSCSI". |
|
IP Version |
The IP version of the iSCSI host is displayed. This item is displayed when the host affinity setting is configured and the selected host is "iSCSI". IPv4 IPv6 |
|
IP Address |
The IP address of the selected iSCSI host is displayed. Note that the IPv6 address is displayed as an abbreviation. If the IP address is not specified, the field is blank. This item is displayed when the host affinity setting is configured and the selected host is "iSCSI". For IPv4 address xxx.xxx.xxx.xxx xxx: 0 - 255 (decimal) For IPv6 address xxxx:xxxx:xxxx:xxxx:xxxx:xxxx:xxxx:xxxx xxxx: 0 - ffff (hexadecimal, "a" - "f" are lowercase letters) Refer to "IPv6 Address Notation" for details. Blank |
|
SAS Address |
The SAS address of the selected host is displayed. This item is displayed when the host affinity setting is configured and the selected host is "SAS". |
|
CA Port : Bandwidth Limit |
The location information and the bandwidth limit of the selected CA port is displayed in "CA Port : Bandwidth Limit" format. [CA Port] For the ETERNUS DX900 S5 or the ETERNUS DX8900 S4 CE#x CM#y CA#z Port#w For the other models CM#y CA#z Port#w x: CE number y: CM number z: CA number w: Port number [Bandwidth Limit] If the performance limit has not been configured, "Unlimited" is displayed for "Bandwidth Limit". Refer to the "Port QoS" column in Bandwidth Limit for details. |
|
CA Port Group |
If a CA port that is connected to the selected host belongs to a CA port group as a member, the CA port group name is displayed. If the CA port does not belong to a CA port group as a member, a "-" (hyphen) is displayed. |
|
LUN Group : LU QoS Group |
The LUN group name and LU QoS group number (0 to 1055) are displayed in "LUN Group : LU QoS Group" format. If the host, ports, and LUNs are allocated without specifying a host group or port group by an application other than Web GUI, a "-" (hyphen) is displayed. If an LU QoS group number has not been configured, a "- " (hyphen) is displayed as "LU QoS Group". |
Performance Information
| Item | Description |
|---|---|
|
Login IP Address |
IP address that is logged in is displayed. The performance information is displayed for each specified IP address. Note that the IPv6 address is displayed as an abbreviation. If there is no IP address, a "-" (hyphen) is displayed. This item is displayed for the iSCSI host when the host affinity setting is configured, the iSCSI name is specified, and the IP address is not specified. For IPv4 address xxx.xxx.xxx.xxx xxx: 0 - 255 (decimal) For IPv6 address xxxx:xxxx:xxxx:xxxx:xxxx:xxxx:xxxx:xxxx xxxx: 0 - ffff (hexadecimal, "a" - "f" are lowercase letters) Refer to "IPv6 Address Notation" for details. |
Performance Monitoring
| Item | Description | |||||||||||||||||||||||||||
|---|---|---|---|---|---|---|---|---|---|---|---|---|---|---|---|---|---|---|---|---|---|---|---|---|---|---|---|---|
|
State |
The status of performance monitoring for the host is displayed. Active Stopped |
|||||||||||||||||||||||||||
|
Start Time |
The start time and the end time for performance monitoring are displayed. The displayed time varies depending on how the performance monitoring is started or ended.
In the following conditions, "-" is displayed for "Start Time" and "Stop / Collect Time".
Caution
|
|||||||||||||||||||||||||||
|
Stop / Collect Time |
Host Total Performance
When the host affinity setting is configured by a port and a specific host group, the total performance information for the specific host that is connected to the port is displayed.
If an IP address is not specified and multiple IP addresses are logged in with the iSCSI host that is connected to the target port, the performance information of each IP address is displayed.
| Item | Description | |
|---|---|---|
|
IOPS |
Ave |
The performance information from when performance monitoring is started until performance monitoring is ended (or performance information is displayed) is displayed. In this field, the average I/O count per second, the minimum I/O count per second, and the maximum I/O count per second are displayed. |
|
Min |
||
|
Max |
||
|
Throughput |
Ave |
The transfer data size from when performance monitoring is started until performance monitoring is ended (or performance information is displayed) is displayed. In this field, the average data transfer size per second, the minimum data transfer size per second, and the maximum data transfer size per second are displayed. |
|
Min |
||
|
Max |
||
|
Delay Time |
Total |
The total delay time for executing a command from when performance monitoring is started until performance monitoring is ended (or performance information is displayed) is displayed. If the total delay time reaches the maximum value, "Overflow" is displayed. |
|
Ave |
The average delay time per command from when performance monitoring is started until performance monitoring is ended (or performance information is displayed) is displayed. |
|
Host LUN Performance
The performance information of each LUN is displayed for the specific host (when "All" is specified for the host, any host) that is connected to the port.
| Item | Description | |
|---|---|---|
|
Host LUN |
The host LUN (0 to 1023) is displayed. |
|
|
Volume Name |
The volume name is displayed. |
|
|
IOPS |
Ave |
The performance information from when performance monitoring is started until performance monitoring is ended (or performance information is displayed) is displayed. In this field, the average I/O count per second, the minimum I/O count per second, and the maximum I/O count per second are displayed. |
|
Min |
||
|
Max |
||
|
Throughput |
Ave |
The transfer data size from when performance monitoring is started until performance monitoring is ended (or performance information is displayed) is displayed. In this field, the average data transfer size per second, the minimum data transfer size per second, and the maximum data transfer size per second are displayed. |
|
Min |
||
|
Max |
||
|
Delay Time |
Total |
The total delay time for executing a command from when performance monitoring is started until performance monitoring is ended (or performance information is displayed) is displayed. If the total delay time reaches the maximum value, "Overflow" is displayed. |
|
Ave |
The average delay time per command from when performance monitoring is started until performance monitoring is ended (or performance information is displayed) is displayed. |
|