
Active IQ Unified Manager 9.16 ( CA08871-240 ~ 251 )
Active IQ Unified Manager 9.16 docs
Get started
Install Unified Manager on VMware vSphere systems
Requirements for installing Unified Manager
Virtual infrastructure and hardware system requirements
VMware software and installation requirements
Installing, upgrading, and removing Unified Manager software
Overview of the deployment process
Upgrading Unified Manager
Supported upgrade path for Unified Manager versions
Install Unified Manager on Linux systems
Requirements for installing Unified Manager
Virtual infrastructure and hardware system requirements
Linux software and installation requirements
Installing, upgrading, and removing Unified Manager software
Overview of the installation process
SELinux requirements on NFS or CIFS share
Installing Unified Manager on Linux systems
Creating a custom user home directory and umadmin password prior to installation
Install Unified Manager on Windows systems
Requirements for installing Unified Manager
Virtual infrastructure and hardware system requirements
Windows software and installation requirements
Perform configuration and administrative tasks
Configuring Active IQ Unified Manager
Overview of the configuration sequence
Accessing the Unified Manager web UI
Performing the initial setup of the Unified Manager web UI
Configuring Unified Manager to send alert notifications
Configuring event notification settings
Enabling remote authentication
Disabling nested groups from remote authentication
Setting up authentication services
Changing the local user password
Configuring Unified Manager backup
Managing feature settings
Enabling policy-based storage management
Enabling Active IQ portal events
Enabling and disabling security settings for compliance
Using the maintenance console
What functionality the maintenance console provides
What the maintenance user does
Accessing the maintenance console
Accessing the maintenance console using the vSphere VM console
Changing the maintenance user password on Windows
Changing the umadmin password on Linux systems
Changing the ports Unified Manager uses for HTTP and HTTPS protocols
Managing SAML authentication settings
Identity provider requirements
Changing the identity provider used for SAML authentication
Updating SAML authentication settings after Unified Manager security certificate change
Managing authentication
Editing authentication servers
Deleting authentication servers
Monitor and manage storage
Introduction to Active IQ Unified Manager
Introduction to Active IQ Unified Manager health monitoring
Introduction to Active IQ Unified Manager performance monitoring
Understanding the user interface
Using the Unified Manager Help
Bookmarking your favorite Help topics
Exporting storage data as reports
Provisioning and managing workloads
Managing and monitoring MetroCluster configurations
Volume behavior during switchover and switchback
Managing quotas
Viewing user and user group quotas
Creating rules to generate email addresses
Creating an email notification format for user and user group quotas
Troubleshooting
Adding disk space to the Unified Manager database directory
Adding space to the data disk of the VMware virtual machine
Adding space to the data directory of the Linux host
Adding space to the logical drive of the Microsoft Windows server
Changing the performance statistics collection interval
Changing the length of time Unified Manager retains event and performance data
Manage events and alerts
Managing events
What Active IQ platform events are
What happens when an event is received
Viewing events and event details
Acknowledging and resolving events
Assigning events to specific users
Fixing issues using Unified Manager automatic remediations
Enabling and disabling Active IQ event reporting
Uploading a new Active IQ rules file
How Active IQ platform events are generated
Resolving Active IQ platform events
Configuring event retention settings
What a Unified Manager maintenance window is
Scheduling a maintenance window to disable cluster event notifications
Managing host system resource events
Understanding more about events
Description of event severity types
Description of event impact levels
Description of event impact areas
Monitor and manage cluster performance
Introduction to Active IQ Unified Manager performance monitoring
Unified Manager performance monitoring features
Unified Manager interfaces used to manage storage system performance
Cluster configuration and performance data collection activity
Navigating performance workflows in the Unified Manager GUI
Monitoring cluster performance from the Dashboard
Understanding performance panels on the Dashboard
Troubleshooting workloads using the workload analyzer
What data does the workload analyzer display
Monitoring performance using the Performance Inventory pages
Viewing Performance inventory pages for all storage objects
Refining Performance inventory page contents
Searching on Object Inventory Performance pages
Understanding the Unified Manager recommendations to tier data to the cloud
Monitoring performance using the Performance Explorer pages
Apply filtering to reduce the list of correlated objects in the grid
Defining the list of correlated objects for comparison graphing
Types of performance counter charts
Selecting performance charts to display
Expanding the Counter Charts pane
Changing the Counter Charts focus to a shorter period of time
Viewing event details in the Events Timeline
Counter Charts Zoom View
Displaying the Counter Charts Zoom View
Specifying the time range in Zoom View
Selecting performance thresholds in Counter Charts Zoom View
Viewing volume latency by cluster component
Viewing SVM IOPS traffic by protocol
Viewing volume and LUN latency charts to verify performance guarantee
Viewing the performance for All SAN Array clusters
Viewing node IOPS based on workloads that reside only on the local node
Managing performance using QoS policy group information
How storage QoS can control workload throughput
Viewing all QoS policy groups available on all clusters
Viewing volumes or LUNs that are in the same QoS policy group
Viewing the QoS policy group settings applied to specific volumes or LUNs
Viewing performance charts to compare volumes or LUNs that are in the same QoS policy group
How different types of QoS policies are displayed in the throughput charts
Viewing workload QoS minimum and maximum settings in the Performance Explorer
Managing performance using performance capacity and available IOPS information
What performance capacity used is
What the performance capacity used value means
Viewing node and aggregate performance capacity used values
Viewing node and aggregate available IOPS values
Viewing performance capacity counter charts to identify issues
Performance capacity used performance threshold conditions
Using the performance capacity used counter to manage performance
Understanding and using the Node Failover Planning page
Using the Node Failover Planning page to determine corrective actions
Components of the Node Failover Planning page
Using a threshold policy with the Node Failover Planning page
Using the Performance Capacity Used Breakdown chart for failover planning
Collecting data and monitoring workload performance
Types of workloads monitored by Unified Manager
Workload performance measurement values
What the expected range of performance is
How the latency forecast is used in performance analysis
How Unified Manager uses workload latency to identify performance issues
Understanding performance events and alerts
Performance event severity types
Configuration changes detected by Unified Manager
Types of system-defined performance threshold policies
Performance event analysis and notification
How Unified Manager determines the performance impact for an event
Managing performance thresholds
How user-defined performance threshold policies work
What happens when a performance threshold policy is breached
What performance counters can be tracked using thresholds
What objects and counters can be used in combination threshold policies
Creating user-defined performance threshold policies
Assigning performance threshold policies to storage objects
Viewing performance threshold policies
Editing user-defined performance threshold policies
Removing performance threshold policies from storage objects
What happens when a performance threshold policy is changed
What happens to performance threshold policies when an object is moved
Analyzing performance events
Displaying information about performance events
Analyzing events from system-defined performance thresholds
Responding to system-defined performance threshold events
Responding to QoS policy group performance events
Understanding events from adaptive QoS policies that have a defined block size
Responding to node resources overutilized performance events
Analyzing events from dynamic performance thresholds
Identifying victim workloads involved in a dynamic performance event
Identifying bully workloads involved in a dynamic performance event
Identifying shark workloads involved in a dynamic performance event
Performance event analysis for a MetroCluster configuration
Analyzing a dynamic performance event on a cluster in a MetroCluster configuration
Analyzing a dynamic performance event for a remote cluster on a MetroCluster configuration
Responding to a dynamic performance event caused by QoS policy group throttling
Responding to a dynamic performance event caused by a disk failure
Responding to a dynamic performance event caused by HA takeover
Resolving performance events
Confirming that the latency is within the expected range
Review the impact of configuration changes on workload performance
Options for improving workload performance from the client-side
Check for client or network issues
Verify whether other volumes in the QoS policy group have unusually high activity
Move logical interfaces (LIFs)
How enabling Flash Cache on a node can improve workload performance
How enabling Flash Pool on a storage aggregate can improve workload performance
MetroCluster configuration health check
MetroCluster configuration verification
Moving workloads to a different aggregate
Moving workloads to a different node
Moving workloads to an aggregate on a different node
Moving workloads to a node in a different HA pair
Moving workloads to another node in a different HA pair
Use QoS policy settings to prioritize the work on this node
Monitor and manage cluster health
Introduction to Active IQ Unified Manager health monitoring
Unified Manager health monitoring features
Unified Manager interfaces used to manage storage system health
Managing and monitoring clusters and cluster object health
Understanding cluster monitoring
Understanding node root volumes
Understanding events and thresholds for node root aggregates
Viewing the cluster list and details
Checking the health of clusters in a MetroCluster configuration
Viewing the health and capacity status of All SAN Array clusters
Viewing the node list and details
Generating a hardware inventory report for contract renewal
Viewing the Storage VM list and details
Viewing the aggregate list and details
Viewing FabricPool capacity information
Viewing the volume list and details
Viewing details about NFS shares
Viewing details about SMB or CIFS shares
Viewing the list of Snapshot copies
Common Unified Manager health workflows and tasks
Monitoring and troubleshooting data availability
Scanning for and resolving storage failover interconnect link down conditions
Performing corrective action for storage failover interconnect links down
Managing health thresholds
What storage capacity health thresholds are
Configuring global health threshold settings
Configuring global aggregate health threshold values
Configuring global volume health threshold values
Configuring global qtree health threshold values
Configuring lag threshold settings for unmanaged protection relationships
Editing individual aggregate health threshold settings
Managing cluster security objectives
Viewing detailed security status for clusters and storage VMs
Viewing security events that may require software or firmware updates
Viewing how user authentication is being managed on all clusters
Viewing the encryption status of all volumes
Viewing the anti-ransomware status of all volumes and storage VMs
Viewing all active security events
Adding alerts for security events
Managing backup and restore operations
Backup and restore for Unified Manager on virtual appliance
Backup and restore using a MySQL database dump
Configuring the destination and schedule for database dump backups
Backup and restore using Snapshots
Configuring backup on Windows
Configuring backup location for Windows
Configuring Windows host machine
Specifying the destination location for Snapshot copies on Windows
Configuring backup by Snapshot copy from maintenance console
Defining a backup schedule for Linux and Windows
On-demand backup for Unified Manager
Migrating a Unified Manager virtual appliance to a Linux system
Managing and monitoring groups
Prioritizing storage object events using annotations
Adding annotations dynamically
Viewing the annotation list and details
Deleting values from annotations
Adding annotations manually to individual storage objects
Protect and restore data
Creating and troubleshooting protection relationships
Types of SnapMirror protection
Setting up protection relationships in Unified Manager
Configuring a connection between Workflow Automation and Unified Manager
Verifying Unified Manager data source caching in Workflow Automation
What happens when OnCommand Workflow Automation is reinstalled or upgraded
Removing OnCommand Workflow Automation setup from Unified Manager
Performing a protection relationship failover and failback
Breaking a SnapMirror relationship from the Volume / Health details page
Reversing protection relationships from the Volume / Health details page
Removing a protection relationship from the Volume / Health details page
Resynchronizing protection relationships from the Volume / Health details page
Managing and monitoring protection relationships
Viewing volume protection status
Viewing volume protection relationships
Monitoring LUNs in a Consistency Group relationship
Creating a SnapVault protection relationship from the Health / All Volumes view
Creating a SnapVault protection relationship from the Volume / Health details page
Creating a SnapMirror protection relationship from the Health / All Volumes view
Creating a SnapMirror protection relationship from the Volume / Health details page
Creating a SnapMirror relationship with version-flexible replication
Creating SnapMirror relationships with version-flexible replication with backup option
Configuring destination efficiency settings
Creating SnapMirror and SnapVault schedules
Editing protection relationships from the Volume Relationships page
Editing protection relationships from the Volume / Health details page
Creating a SnapMirror policy to maximize transfer efficiency
Creating a SnapVault policy to maximize transfer efficiency
Aborting an active data protection transfer from the Volume Relationships page
Aborting an active data protection transfer from the Volume / Health details page
Quiescing a protection relationship from the Volume Relationships page
Quiescing a protection relationship from the Volume / Health details page
Breaking a SnapMirror relationship from the Volume Relationships page
Removing a protection relationship from the Volume Relationships page
Resuming scheduled transfers on a quiesced relationship from the Volume Relationships page
Resuming scheduled transfers on a quiesced relationship from the Volume / Health details page
Initializing or updating protection relationships from the Volume Relationships page
Initializing or updating protection relationships from the Volume / Health details page
Resynchronizing protection relationships from the Volume Relationships page
Reversing protection relationships from the Volume Relationships page
Restoring data using the Volume / Health details page
Viewing resource pools inventory
Removing aggregates from resource pools
Monitoring Storage VM Disaster Recovery protection relationships
Monitoring Storage VMs using Relationships page
Understanding Storage VM Associations
SVM and resource pool requirements to support storage services
Retrying a failed protection job
Description of Protection relationships windows and dialog boxes
Create Resource Pool dialog box
Advanced Secondary Settings dialog box
Advanced Destination Settings dialog box
Configure Protection dialog box
Create SnapMirror Policy dialog box
Create SnapVault Policy dialog box
Select Source Snapshot Copy dialog box
Relationship / All Relationships view
Generate custom reports
Unified Manager reporting
Working with reports
Sample custom reports
Customizing cluster storage reports
Creating a report to view capacity by cluster model
Creating a report to identify clusters with the most unallocated LUN capacity
Creating a report to view HA pairs with the most available capacity
Creating a report to view nodes running older versions of ONTAP
Customizing aggregate capacity reports
Creating a report to view aggregates reaching full capacity
Creating a report to view aggregates that are 80% or more full
Customizing volume capacity reports
Creating a report to identify volumes nearing full capacity that have Snapshot Autodelete turned off
Creating a report to identify space used by volumes with thin provisioning disabled
Customizing NFS share reports
Creating a report to view volumes that have an inaccessible mount path
Creating a report to view volumes that are using the default export policy
Customizing storage VM reports
Creating a report to view storage VMs reaching the maximum volume limit
Customizing volume relationship reports
Creating a report to group volume relationships by source of failure
Creating a report to group volume relationships by issue
Creating a report to view volume transfer trends at specific time intervals
Creating a report to view failed or successful volume transfer
Creating a report to view volume transfers based on transfer size
Manage storage using REST APIs
Getting started with Active IQ Unified Manager
Active IQ Unified Manager API access and categories
REST services offered in Active IQ Unified Manager
REST API access and authentication in Active IQ Unified Manager
HTTP status codes used in Active IQ Unified Manager
Recommendations for using the APIs for Active IQ Unified Manager
Unified Manager REST APIs
Managing storage objects in a data center
Accessing ONTAP APIs through proxy access
Performing administrative tasks
Monitoring MetroCluster configurations
You can monitor connectivity issues in your MetroCluster configuration. The details include the status of the components and connectivity within a cluster and the connectivity status between the clusters in the MetroCluster configuration. Here, you will get to know how to monitor connectivity issues in clusters protected by MetroCluster over IP configurations.
You can monitor the MetroCluster configurations from the following views from the Active IQ Unified Manager left navigation pane:
-
Storage > Clusters > Protection: MetroCluster view
-
Protection > Relationships > Relationship: MetroCluster view
Unified Manager uses system health alerts to indicate the status of the components and connectivity in the MetroCluster configuration.
-
Both the local and remote clusters in a MetroCluster configuration must be added to Active IQ Unified Manager.
-
In a MetroCluster over IP configuration, if a Mediator is to be supported, the Mediator should be configured and added to the cluster by corresponding API.
-
You must have the Operator, Application Administrator, or Storage Administrator role.
Monitor connectivity issues in MetroCluster over IP configuration
For clusters in a MetroCluster over IP configuration, the connectivity charts are displayed on the Clusters page. Follow these steps.
-
In the left navigation pane, click Storage > Clusters.
A list of all of the monitored clusters is displayed.
-
From the Protection: MetroClusters view, click the name of the cluster for which you want to view MetroCluster over IP configuration details. Alternately, you can filter by clusters in a MetroCluster configuration.
-
Expand the row by clicking the caret
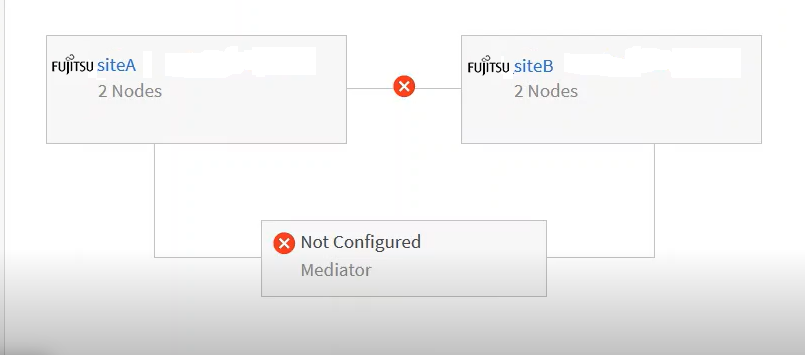
vicon. The caret icon appears for only a cluster that this protected by MetroCluster over IP configuration.You can view the topology of the source and mirror sites, as well as the Mediator, if any, used for the connection. You can view the following information:
-
Connectivity across the sites
-
Health and availability issues, if any, on both the sites
-
Mediator-related issues
-
Replication related issues.
The following statuses are reported: Critical (  ), Error (
 ), or Normal (
 ). You can also view the aggregate data replication status of the primary and mirror data in the same topology.
In the following diagram, you can see that the intersite connectivity between the source and destination clusters is unavailable, and the Mediator between them is not configured.
-
-
Click the status icon. A message with the error definition is displayed. If an event has been raised for the issue in your MetroCluster over IP configuration, you can click the View Event button on the message and view the event details. When you have resolved the issue and the event, the status icon in this topology turns to normal (
). -
You can view further configuration details in the MetroCluster Overview and Protection sections on the Configuration tab of the Cluster / Health details page.
| Only for a MetroCluster over IP configuration, you can have view the cluster topology on the Clusters page. For clusters in a MetroCluster configuration, the topology is displayed on the MetroCluster Connectivity tab on the Cluster / Health details page. |
Related information
-
For information about Relationship:MetroCluster view, see Monitoring MetroCluster configurations.
-
For information about Relationship: Last 1 month Transfer Status view, see Relationship: Last 1 month Transfer Status view.
-
For information about Relationship: Last 1 month Transfer Rate view, see Relationship: Last 1 month Transfer Rate view.
-
For information about Relationship: All Relationships view, see Relationship: All Relationships view.